Turnover
Quantitative research has substantiated what practicing managers have always known intuitively – a moderate rate of employee turnover is desirable and improves the overall performance of an organization. The figure below illustrates this relationship. For this relationship to hold, the turnover must meet certain conditions and is thereby designated as "good" turnover.
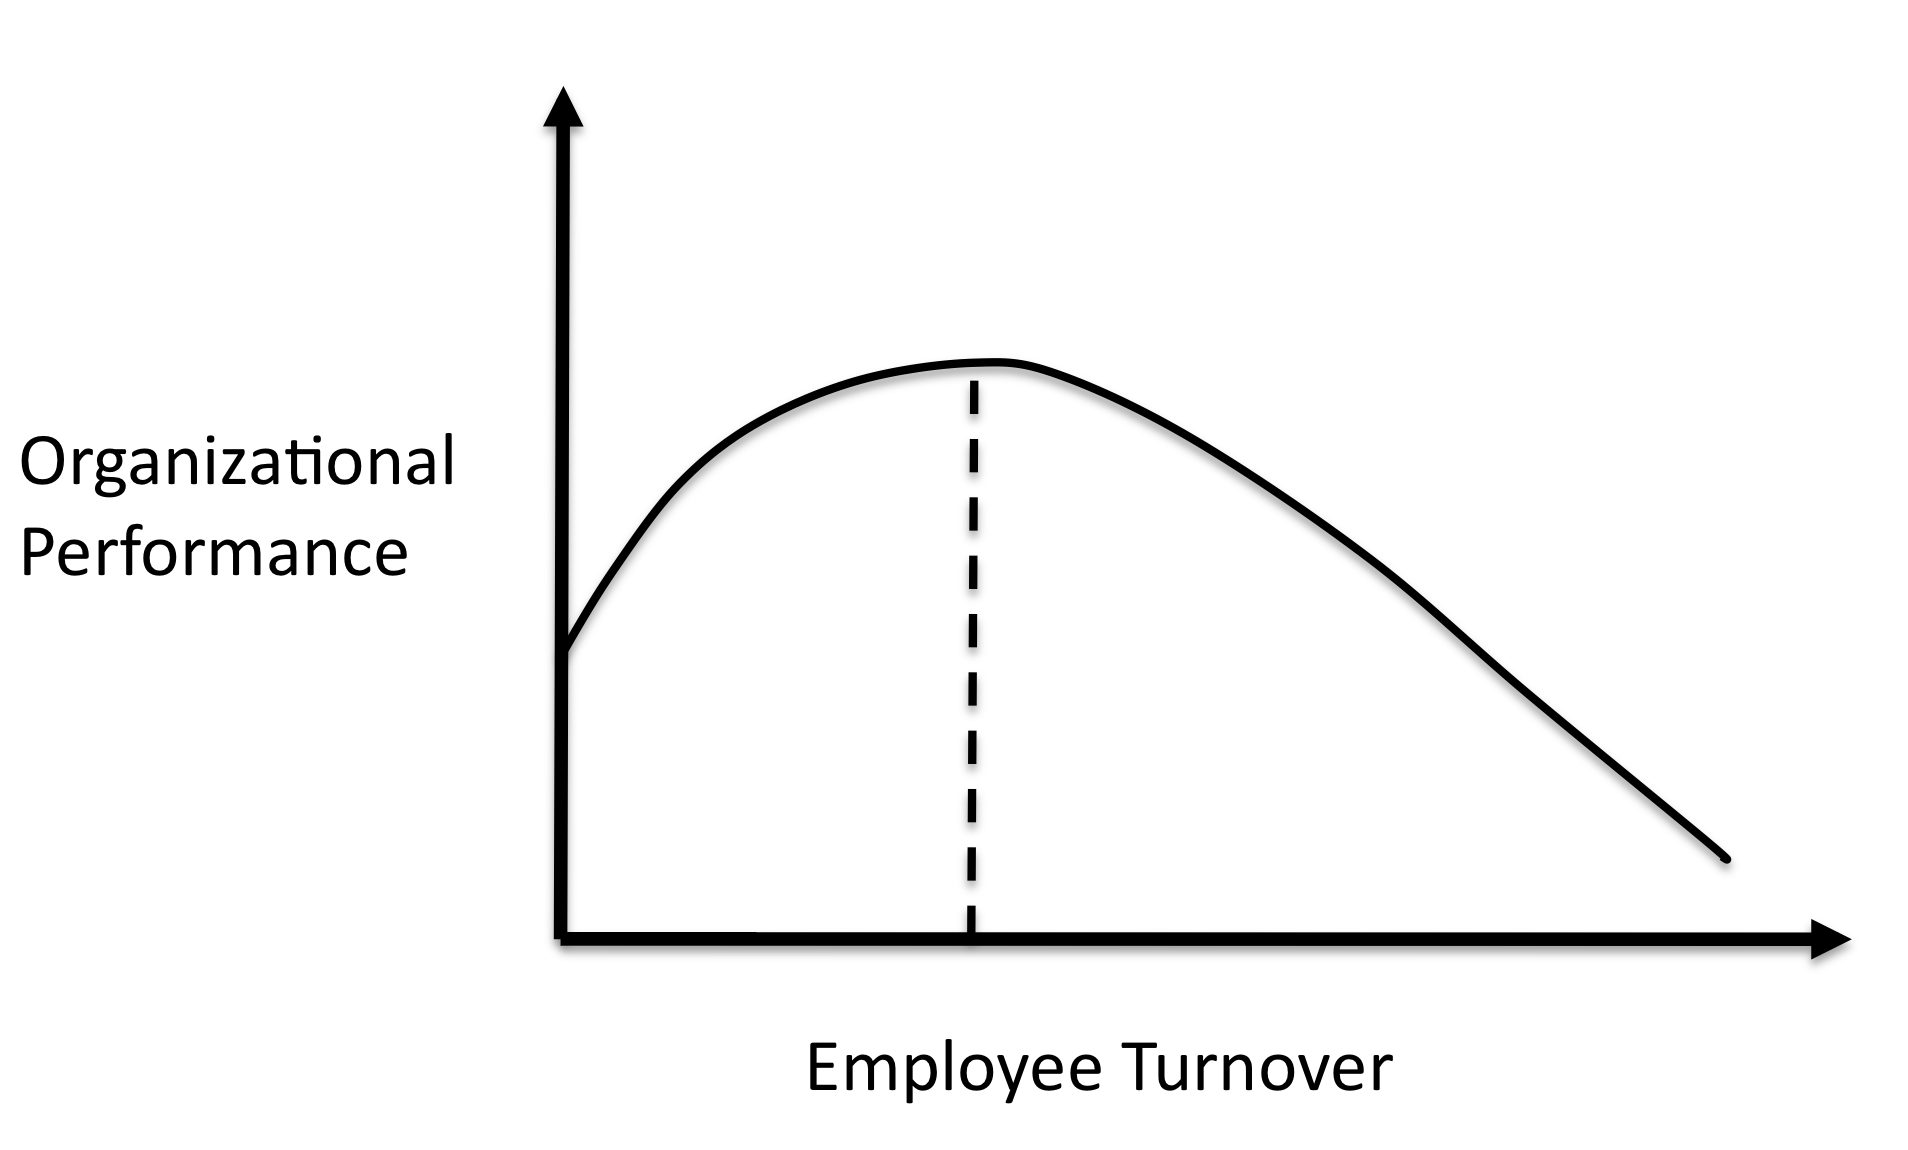
Employee turnover is defined as the annual rate at which departing employees are replaced. For example, if 5% of a company's employees depart during the year and are replaced with new employees, then the turnover rate is 5%. Turnover includes employees who leave voluntarily for other opportunities, as well as employees dismissed. Turnover does not include employees who move within a firm; mobility measures internal employee moves. Turnover and mobility can vary from year to year; the long-term average rate and its volatility are important metrics.
In this section we will discuss the following topics:
What constitutes "good" turnover,
Why moderate good turnover improves performance,
Appropriate measures of good turnover, and
How to encourage good turnover in an organization.
What constitutes good turnover
The overall rate of employee turnover by itself tells very little about what is happening in an organization. For example, if a company has 5% turnover, that can be a good thing (if it represents the lowest performers in the firm) or a bad thing (if it represents the best performers). When we say that moderate turnover can help an organization, we mean moderate good turnover. To facilitate our discussion of good turnover, we use the example below.
A senior member of a company's management team (Senior Mgr 4) has had steadily decreasing performance, and is now exiting the organization. His departure sets off a chain reaction of moves within the company and an infusion of talent into the company, as shown by the ovals and arrows. First, his position needs to be filled, either by the best manager from a lateral position, from the tier below, or through an outside hire. If it is a manager from the tier below, it could be one of his direct reports, or a manager reporting to one of his peers.
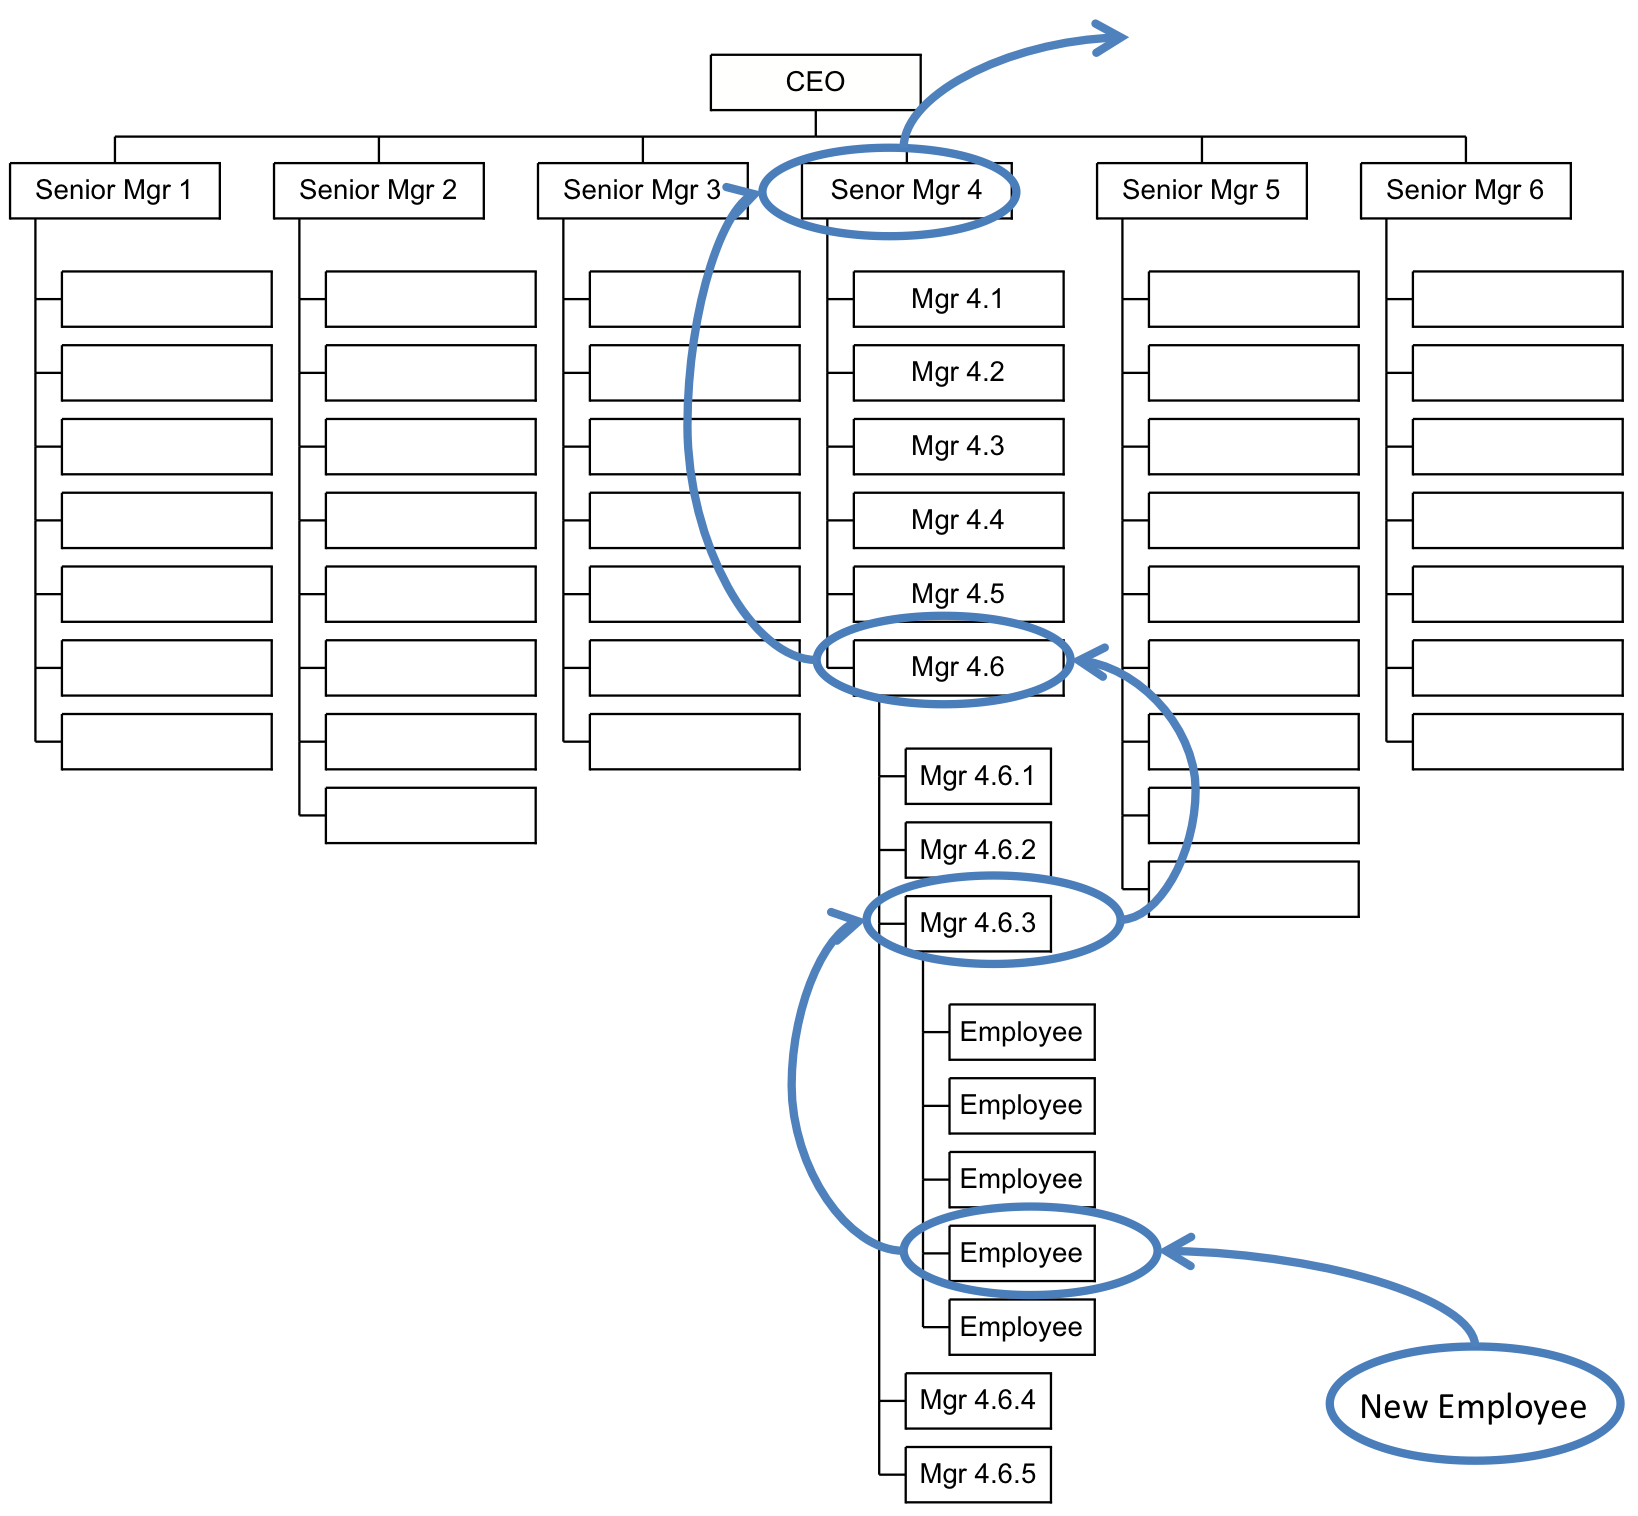
In this case, the best candidate is a manager (Mgr 4.6) who is currently reporting to Senior Mgr 4. In turn, Mgr 4.6's position needs to be filled by an internal or external person, and, so on, down the chain. A talented new employee replaces the promoted employee at the bottom of the chain.
This case exhibits the hallmarks of good turnover: a poor performer was managed out of the organization, which led to internal upward mobility for several of the best managers and employees, followed by an infusion of talent into the organization.
Good turnover may vary based on the type of organization, its industry, and its business model. However, generally speaking, good turnover can be recognized as follows:
The employees leaving the firm are the ones you want to leave. They are generally the lowest performing employees or those no longer needed by the firm,
The employees entering the organization are of a higher quality and better suited to the firm than those who are leaving,
The turnover is distributed uniformly throughout the firm and at the different levels of the firm, and
The turnover is stable over time.
A firm with a disciplined performance rating system can identify its lowest performers annually. Ideally, those employees will be the ones leaving the firm each year; they are the least valuable employees to the firm and their departure can be anticipated and coordinated efficiently. However, the list of departing employees may also be studded with star employees with sparkling performance evaluations. These employees may be on the departure list for a good reason – they no longer fit within the firm, which may be for many reasons. For example, they may work in a country that the company is exiting. When judging the quality of turnover, consider employee performance ratings, but also employee division, function, and region, which may flag special circumstances.
Turning to our second condition for good turnover, entering employees should be of a higher quality than departing employees. At first blush this requirement may seem unreasonably difficult to measure. Clearly it is not practical to do a side-by-side comparison of each departing and entering employee. Frequently the employees entering and leaving are not even remotely equivalent. For example, turning back to our case study, the outgoing person (Senior Mgr 4) and the incoming person (New Employee) do not fill the same role – how could we do a quality comparison in this case? Fortunately there is an easier and more reliable way to measure the relative quality of departing and entering employees.
Consider a hypothetical firm that annually identifies its 10% lowest performers and strongly encourages them to leave the firm. These employees are recognized by their performance ratings of "1", as opposed to the high-performers with ratings of "5", with all other employees somewhere in between. Let's assume that there is a long list of excellent candidates who wish to join the firm. While it is seldom easy or inexpensive to purge low performers, it is well worth the effort for a dramatic improvement in talent. An organization replacing low performers with high performers will make that effort and, as a result, there will be few employees in the organization with a history of "1" performance ratings for more than one or two years. That is, firms with few employees with a history of 1 performance ratings are upgrading their talent.
Now let us examine the opposite case. Let's assume that there is a dearth of excellent external candidates who wish to join the firm. In fact, let's assume that many of the candidates don't seem much better than the 10% low performing employees who received a 1 rating. It is unlikely that the firm will spend the effort and money to force out their low performers, just to hire and train candidates who seem quite similar. This firm will likely have many employees with a history of a 1 performance rating because the firm is not able to upgrade its talent.
The third condition for good turnover is that it is distributed uniformly throughout the firm. This is where reporting only average turnover can be deceptive. If most of the turnover is in one division, one region, or one level of the firm, then the average turnover rate may be fine, but the firm is not fine. This situation suggests a low-turnover firm with pockets of high turnover, both of which are unhealthy, which average out to look like a healthy firm. When evaluating the quality of turnover, examine each division, function, region and level of the firm.
The final condition for good turnover is that it is stable over time. Wild swings between low and high turnover may average out to a reasonable long-term rate, but the swings are not healthy. Furthermore, as we will see shortly, moderate turnover leads to healthy development of the experience base of its managers. Large exoduses and infusions of talent wipe out layers of developing managers and upset that developmental experience.
As we will discuss later, when creating a measurement and analysis capability for your firm, it is imperative that you identify and measure the underlying components of turnover to ensure that your average turnover rates are not masking serious underlying organizational issues.
Why moderate good turnover improves performance
Let's revisit the turnover-performance curve above, beginning on the left-hand side. This graph suggests that firms with no employee turnover do not perform at their peak level (shown by the dashed line). A complete lack of turnover means that the lowest performing employees are not leaving the organization and are not being replaced by better performers. Employees leave even the best firms, and for many reasons: their interests change, opportunities arise elsewhere, they don't adapt to a changing landscape, they become too comfortable and no longer contribute at the level required, they choose not to physically relocate with the firm, the firm changes its focus, and so on.
Low turnover causes all types of issues for a firm. The first and foremost issue is that low-performing employees are not being replaced with better performers. In addition, without turnover there is no mobility upwards in the organization: high-performing, high-potential managers leave for other firms that offer more opportunities. Also, without turnover there is minimal intake of new people with new skills and new knowledge. This leads to organizational stasis.
As we progress towards the right-hand side of the figure, past the dashed line, a different dynamic kicks in. Past the optimal point, employee turnover becomes too rapid and begins impacting the firm negatively. When employee turnover is too high, it disrupts communication and coordination in the normal flow of operations; the employees who provide the 'institutional memory' are walking out the door and being replaced with new employees who are still learning how the firm operates. The employees with connections to customers, regulators, suppliers and analysts are turning over, which disrupts communication with these important constituencies. The firm is spending too much of its time recruiting new employees and training them, which distracts the team from focusing on their daily work and performing at their peak. Finally, the company's culture and team cohesion can be impacted negatively.
At the optimal point (shown by the dashed line) the firm enjoys the benefits of moderate turnover, where management stability and change are complementary. The management structure is stable, with management continuity, a strong institutional memory, consistent interfaces with key constituencies, manageable recruiting and training costs, and an enduring organization culture. The management team also enjoys the benefits of change, including periodic opportunities for advancement, infusion of higher performing talent with new skills, ideas and energy, and a dynamic culture that brings in talent to fit a changing competitive landscape. An organization with healthy turnover creates a virtuous cycle of employee development. Employees moving up the organization's hierarchy are continually being challenged, developing their skills and accumulating diverse, relevant experiences.
Appropriate measures of good turnover
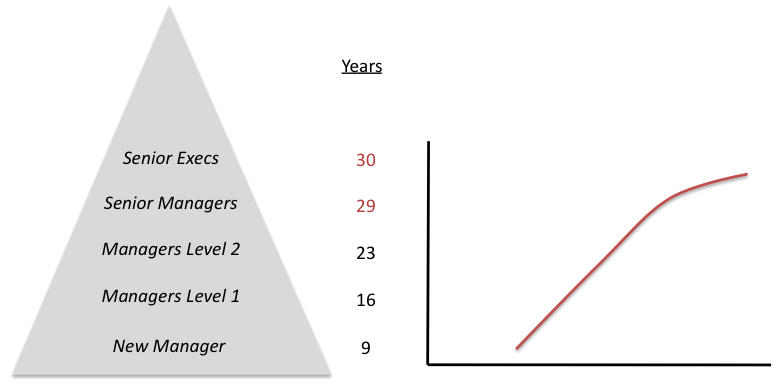
Properly analyzing good turnover requires collecting many metrics throughout the organization over a long period of time. All of those metrics are important for digging in and identifying issues in different parts of the organization. However, it is difficult to distill the state and health of an organization based on 30 pages of turnover time-series metrics. Fortunately there are metrics that unify many of these measures and provide a current snapshot of many years of turnover behavior. Firms with moderate good turnover over a long period of time develop a healthy employee experience curve, as shown below.
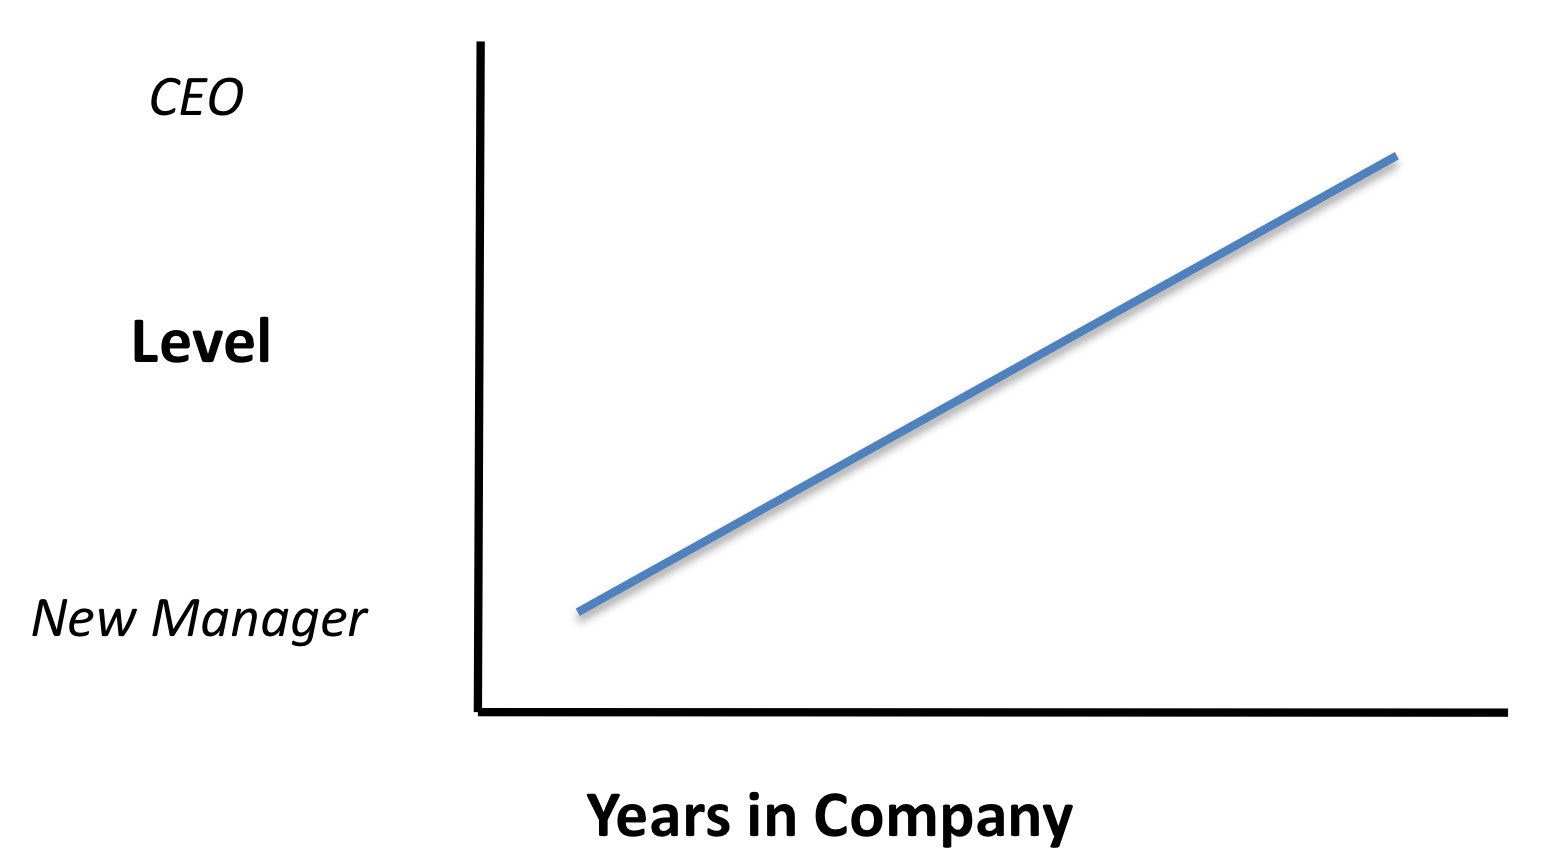
This simple chart shows that managers at the top of the firm have many more years of experience within the firm than newer managers. This seems like a very simple result, given all the complex relationships that go into it, but it is consistent with intuition and experience. Successfully leading a big complex firm through a competitive, global economy requires a diverse set of skills, experiences and network that can be accumulated only through many years of working up through the firm's management hierarchy.
While the result is simple, in practice few firms have this ideal experience curve. Many firms have convoluted curves, which require looking at the component curves of the different divisions, function and regions, which, in turn, require looking at the turnover metrics we described earlier, and sometimes even looking at the metrics for each manager in the organization. Before we dig into curve complexities, let's examine how a firm creates and sustains this experience curve in the presence of constant turnover.
In the beginning of any new company, there is a leader or a small set of leaders. The leader builds the company over a couple of years, hires his/her first employees, the company grows, the employees hire new employees, and so on. Over time, the management structure looks something like the pyramid below. The founding leader is now the CEO, his/her first employees are now the Senior Executives, and the succession of hired employees are now management layers in the organization.
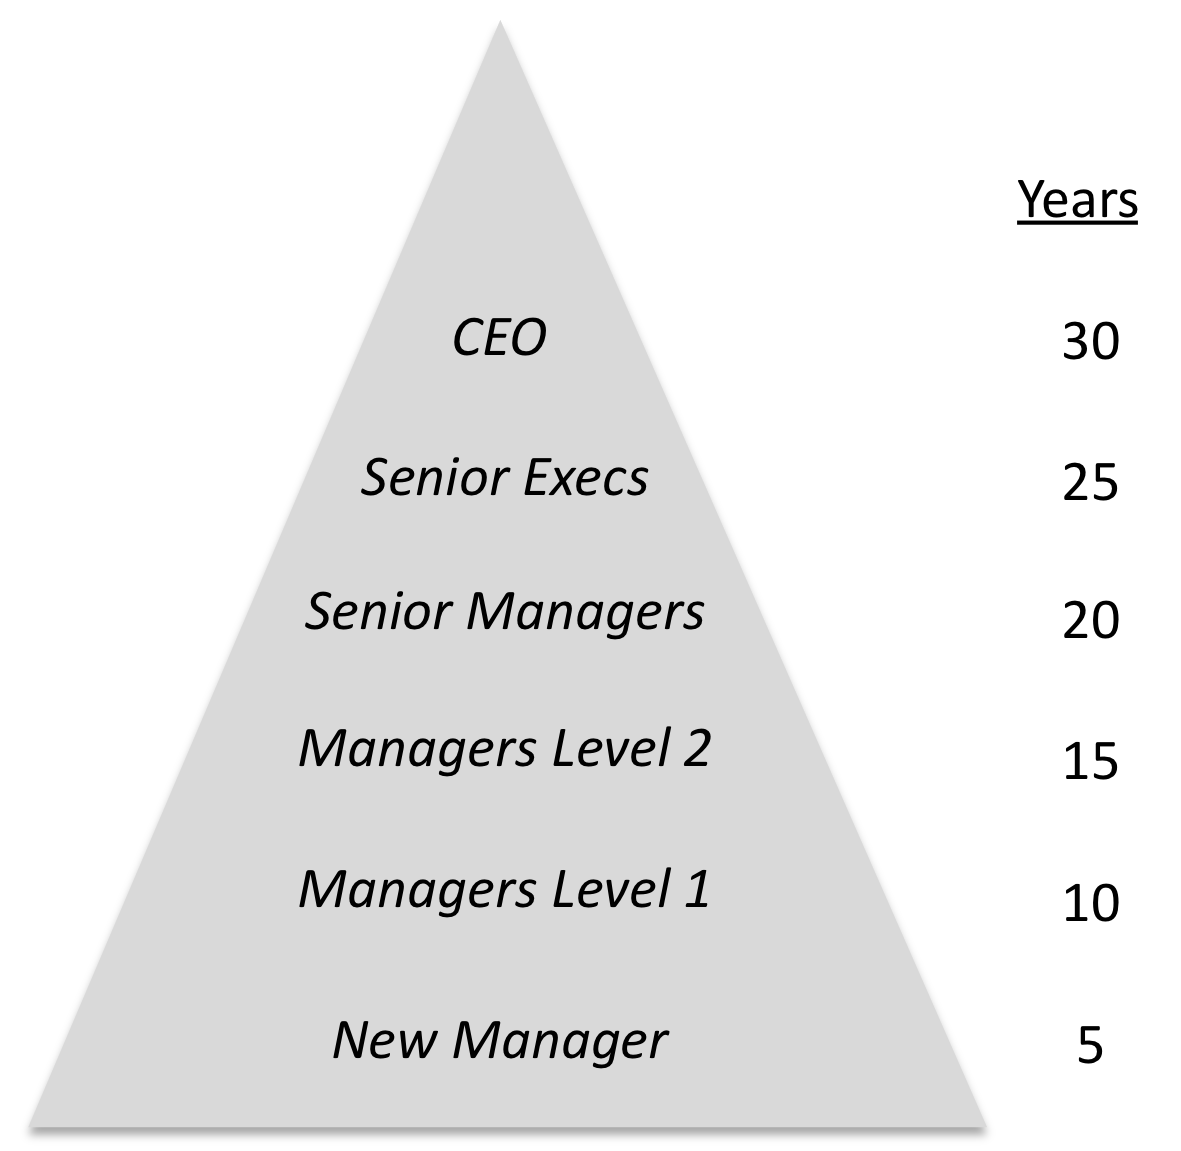
So far, this has been a perfectly natural progression, something we read about every day in the business press, and it is consistent with the experience curve we examined above. However, what happens to this organization and its experience curve over time with good turnover and infusion of external talent? Does the management hierarchy preserve its characteristic of increasing years of experience at the higher levels in the organization, or more simply, does its experience curve keep its same shape?
The answer to these questions is affirmative – if the organization is managing its turnover properly. Even though new employees are being added to the organization continuously, managers at the top of the organization will have more years of experience at the firm than those at the bottom due to promotions and the pyramid shape of management organizations.
The diagram below shows how companies maintain a consistent healthy experience curve. The pyramid on the left is the initial management structure from above. The first column on the left lists the average years of experience within the organization for the managers on that level for a given year (e.g., N = 2011). The middle column computes the average years of experience of those managers through the year, including the impact of turnover. The column on the right lists the average years of experience of those managers the following year (e.g., N+1 = 2012).
For this example, we are assuming personnel change at each level of 10%. At any level in the organization, 90% of the managers don't change and 10% are promoted to the next level or leave the company; these 10% of managers are replaced with managers from the level below them (8%) or by new managers (2%).
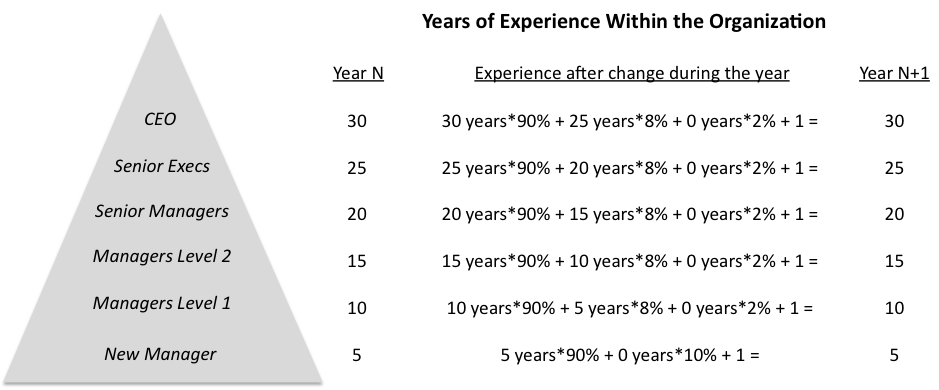
We have not included lateral moves in the calculation because they don't affect the years of experience on any level. The managers on the level below have fewer years of experience than the current level, and the new managers have 0 years of experience in the company. Finally, we add 1 to the calculation to account for the passing of a single year. The left-hand and right-hand columns are identical, which means the experience curve of the organization does not change through time.
Using this approach, we can graph the experience curves for organizations with different turnover rates. As you can see from the figure below, steep slope experience curves spell trouble for an organization. A steep curve on the left-hand side of the figure indicates an organization that has a very high rate of turnover. A steep curve on the right-hand side indicates a very low rate of turnover.
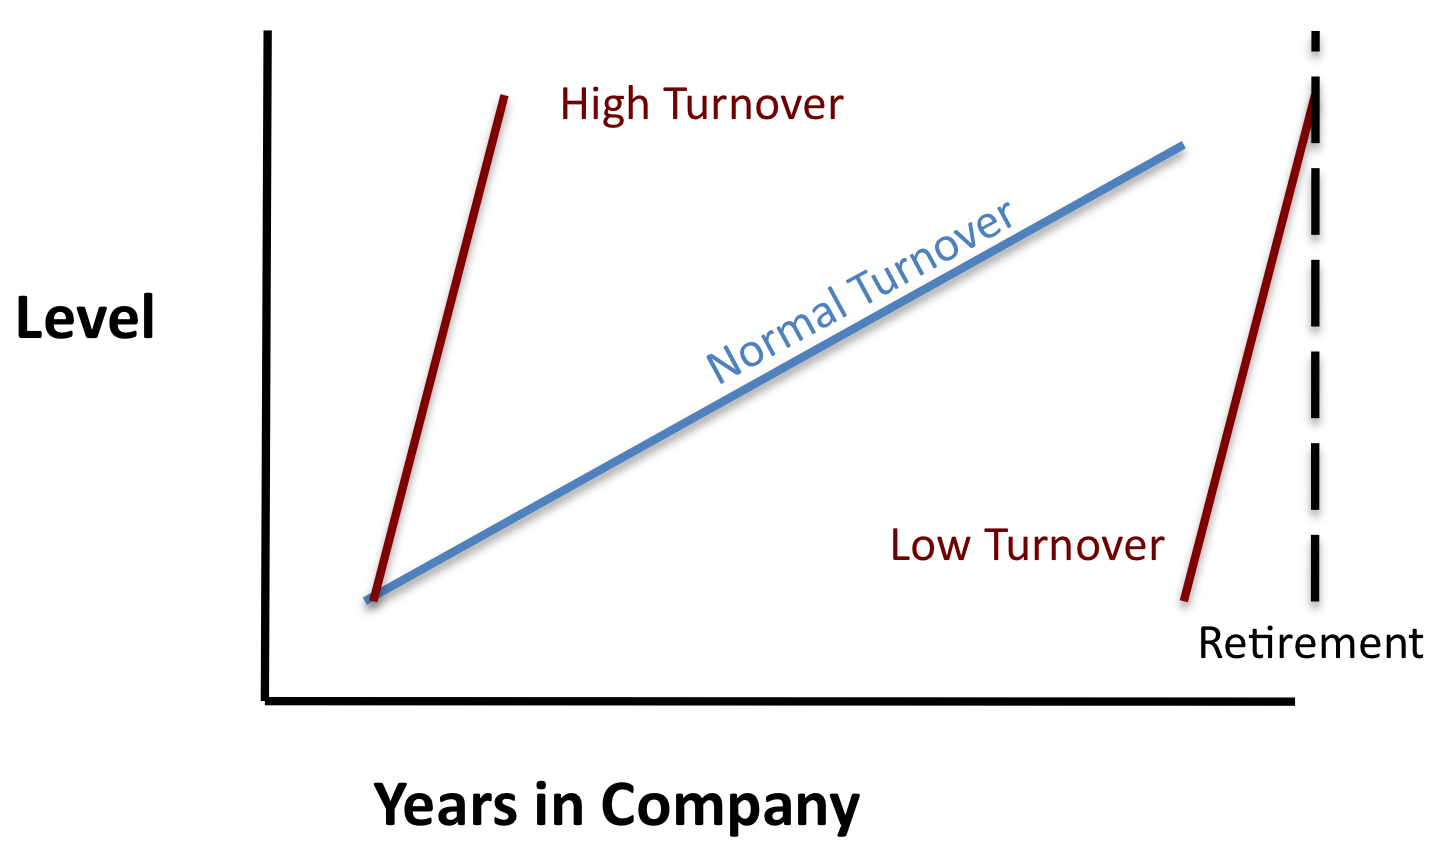
A moderate level of employee turnover alone is not a sure sign of a healthy firm. An average turnover rate may be acceptable, but the average may mask an underlying problem. For example, a seemingly acceptable annual turnover rate of 15% is not acceptable if it is comprised of 0% turnover in the staff functions and 30% turnover in the sales group, or 0% turnover in Europe and 30% in Asia. It is important that employee turnover is evenly distributed throughout the organization and that it occurs at a moderate rate year after year. Let's look at some examples of employee experience curves.
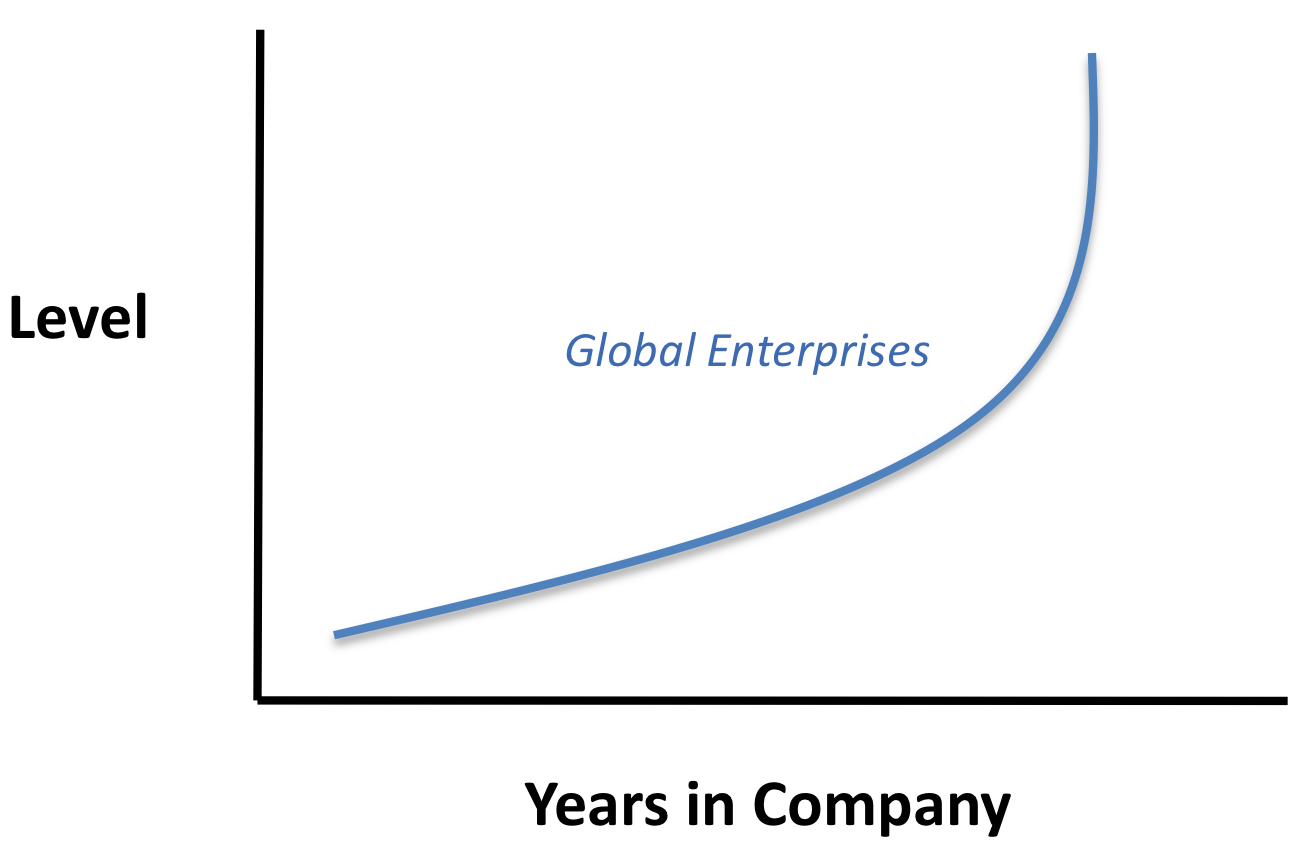
Below is the experience curve for Global Enterprises. Does it look like the experience curve of a healthy company? Not only is it unclear, it is confusing as to what is going on with the curve spiking upward towards the right-hand side. However, by looking at the underlying experience curves, starting with regional curves, you can see how we arrived at this puzzling company curve.
The diagram below shows Global Enterprise's experience curve on the left, and the component curves for its three regions on the right. Now we can see the reason for the strangely upturned curve – an even more oddly shaped curve for the North America division.
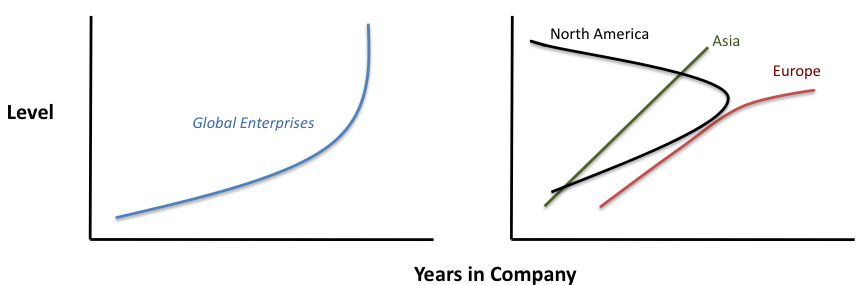
Global Enterprise's corporate headquarters is in North America. The Board replaced the company's CEO with an outsider, and he recruited his senior team from a rival firm. Now it makes sense. Look at the North America curve, starting from the bottom, and traversing to the top. It begins with a normal experience curve, but then takes a sharp turn left where the senior managers from the rival firm begin averaging into the curve of the existing managers. At the top, on the far left, is the new CEO.
Turning to the other regions, Asia seems to have fairly high turnover and Europe has more normal turnover, but with a strange twist near the longer tenure end of the curve, as shown below.
Looking at Europe by organization level, we find that the senior staff there is no longer advancing in the firm, and not being forced to move on to other roles or outside the firm. They have become a bottleneck in management mobility that the company could address by promoting good turnover.
How to encourage good turnover
Good employees may leave a firm for many reasons, including uncompetitive compensation or benefits, excessive workload, bad firm culture, poor morale, lack of advancement opportunities, diminishing status of the firm versus competitors, and industry-related problems, to name a few. The time-tested approaches to managing high turnover include employee satisfaction surveys and associated task forces, exit interviews for departing employees, compensation benchmark studies, and adopting management practices that are being used by companies that are attracting your departing employees.
Excessively low turnover is usually due to a different set of forces. Employees may be too comfortable, even the lowest performing employees. This may be due to a lack of a disciplined performance assessment system, uncompetitive compensation and benefits (i.e., too generous), and the like. If a firm does not have sufficient good turnover, it can be encouraged through mobility planning and talent upgrading.